SB 350 Myths and Facts
California’s leadership on climate and clean energy has generated billions of dollars of in-state investment, spurring job creation and strong growth in new industries, and paving the way for other jurisdictions around the world to follow suit.
Setting aggressive, enforceable new targets will drive additional investment and job-growth to ensure that progress continues and is enjoyed by all Californians.

January
In his State of the State address in January, Governor Brown announced ambitious new energy and climate goals for California. The governor called for statewide targets of up to a 50% reduction in petroleum use in our cars and trucks, 50% electricity generation from renewable sources, and to double the energy efficiency of buildings, all by 2030.

February
In February, Senate President pro Tempore Kevin de León introduced Senate Bill 350, the Clean Energy and Pollution Reduction Act of 2015, to codify and implement the Governor’s goals. The bill was approved in the Senate in June and is now up for a vote in the Assembly before reaching the Governor’s desk for his signature.

Now
Opponents of the bill, led by profit-driven oil companies and their lobbyists, have mobilized an aggressive misinformation campaign designed to intimidate lawmakers and diminish public support.
We cannot afford to delay action any longer. Climate change is already wreaking havoc on California’s economy, climate and quality of life, and the effects will only intensify the longer we wait to act.
With stakes so high, it is especially important to dispel the myths surrounding this debate.
SB 350 and the Economy
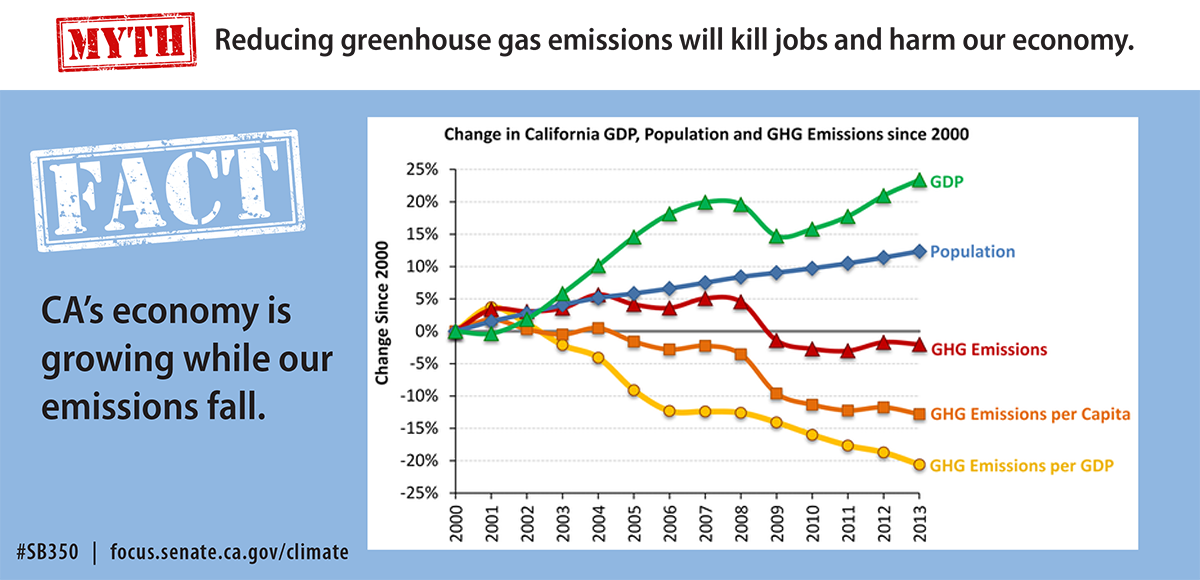

California’s GDP is nearly 30% higher than it was in 2006 ($2.2 trillion vs. $1.6 trillion), and our economy is now 28% less carbon intensive (per dollar of economic activity) than it was in 1990. Our GDP is growing while our emissions fall.

California’s total non-farm employment of over 16 million is at an all-time high.

California is now the 7th largest economy in the world by Gross Domestic Product.

Since the recession ended, California leads the nation in private sector job growth, adding 1.6 million jobs.
- California added nearly half a million jobs in 2014, for job growth of 3.1%, higher than the national average of 2.3%.
- California added 52,400 jobs in May 2015, a faster rate than any other state.

California captured half ($5.7 billion) of clean tech global venture capital investment in 2014 – second only to the U.S. as a whole – helping to fuel the largest advanced energy industry in the U.S. at 430,000 workers and growing.
- In 2013 alone, employment in California’s solar industry grew nearly 16% - 10 times faster than the statewide average.
- California’s solar industry employed 55,000 people in 2014, more than the state’s five major major utilities combined. Solar companies expect to add nearly 10,000 more jobs in 2015.
SB 350 and Manufacturing
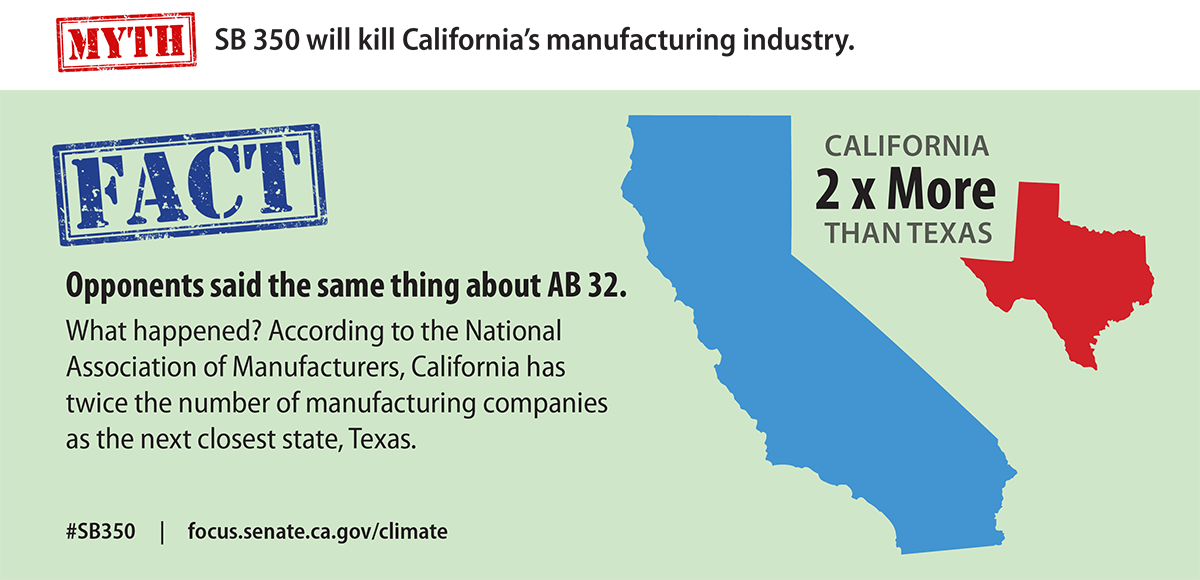

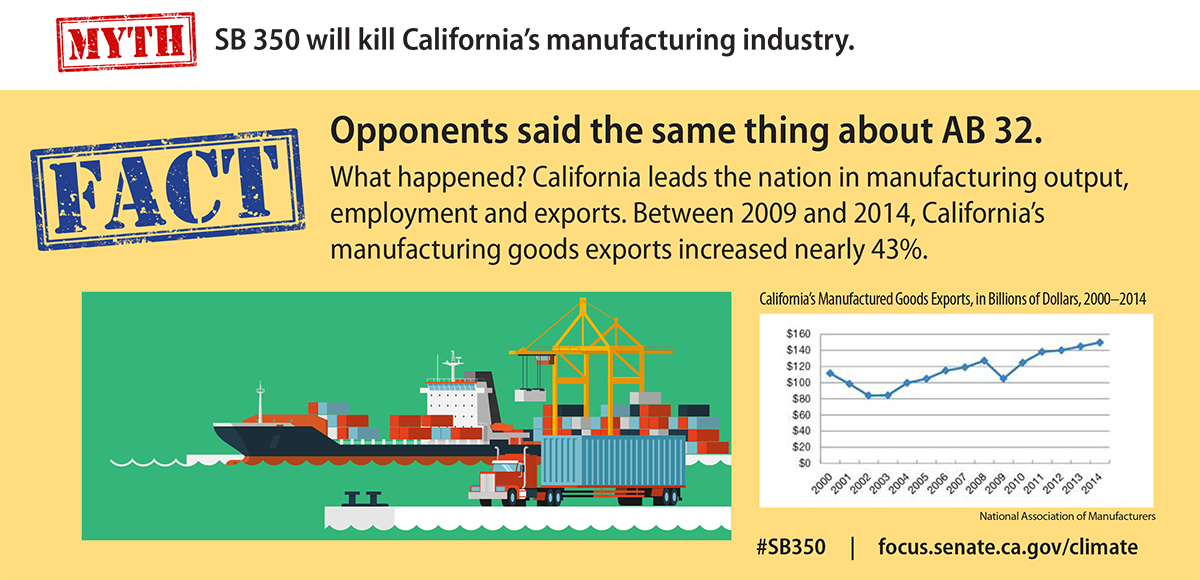
California leads the nation in manufacturing employment, and output despite our aggressive greenhouse gas reduction policies. The state has added manufacturing jobs for three straight years

California leads the nation with $149.8 billion in annual manufacturing exports. Between 2009 and 2014, California’s manufacturing goods exports increased nearly 43%.

According to the National Association of Manufacturers, California has twice the number of manufacturing companies as the next closest state, Texas, led by aerospace and advanced manufacturing.

California manufacturers added 31,525 jobs from March 2014 to March 2015, an increase of 2%, slightly ahead of the 1.5% national average increase reported by the Labor Department for the same time period. (Manufacturer’s News Inc.).
SB 350 and consumers

California’s clean transportation policies will save over $8 billion on health care costs due to fewer asthma attacks, cardiac hospitalizations, and premature deaths from poor air quality.

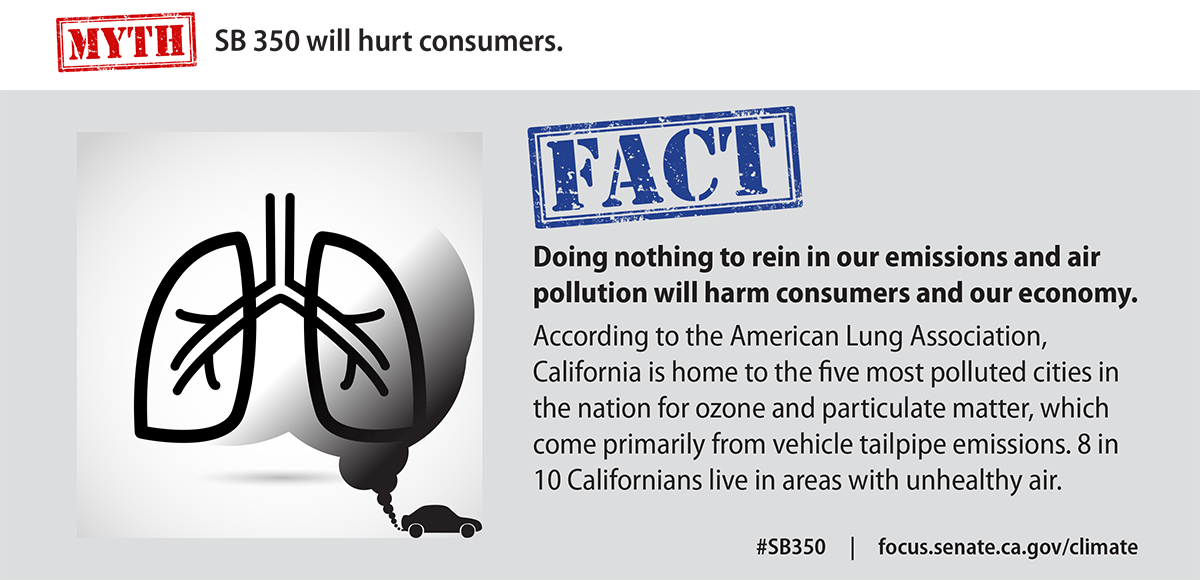
Doing nothing to reign in our emissions and air pollution will harm consumers and our economy. Failing to act leaves Californians exposed to the dangerous and costly impacts of climate change.
- According to the American Lung Association, California is home to the five most polluted cities in the nation for ozone and particulate matter, which come primarily from vehicle tailpipe emissions. 8 in 10 Californians live in areas with unhealthy air.
- Twice as many Californians die early deaths from the health impacts of vehicular pollution than from motor vehicle accidents every year.
- A 2008 study by CSU Fullerton researchers found that air pollution costs Californians $28 billion in added healthcare costs and lost income each year. Residents of the San Joaquin Valley suffered the most, losing roughly $1600 per person per year.
- Between 2003 and 2012, California spent upwards of $4 billion to fight wildfires, not including the costs to human health and property.
- Seven of the ten largest wildfires in California history have occurred since 2001.
- All told, the state will spend several billion dollars responding to our historic drought; and U.C. Davis scientists estimate that the toll on our agriculture industry will approach $5 billion for the 2014 ($2.2 billion) and 2015 ($2.7 billion) calendar years.
- According to recent research published in the scientific journal, Lancet, climate change “threatens to undermine the last half century of gains in development and global health.” The report also concluded that “tackling climate change could be the greatest global health opportunity of this century.”

Californians receive a “climate credit” rebate on utility bills twice a year. In April 2014, this rebate averaged $35 per household – more money that can be spent on other household needs or reinvested in energy efficiency measures to save even more
SB 350 and gas prices
There are many factors that contribute to fluctuating prices the pump, but climate policies are not among the top causes. The main catalysts for changes in gasoline prices are volatility in global crude oil markets, seasonal demand, and refinery outages and planned maintenance

Oil company lobbyists said gas prices would spike 16-76 cents in January because of cap and trade. In a March Senate Oversight hearing, the California Energy Commission and oil industry analysts alike noted little to no effect on gas prices following the inclusion of vehicle fuels in cap and trade.

California gas prices spiked more than $1 in February and March due to a refinery explosion in Torrance, and another refinery shut down in Benicia following labor disputes Analysts at GasBuddy.com called this the most aggressive price spike in California history.
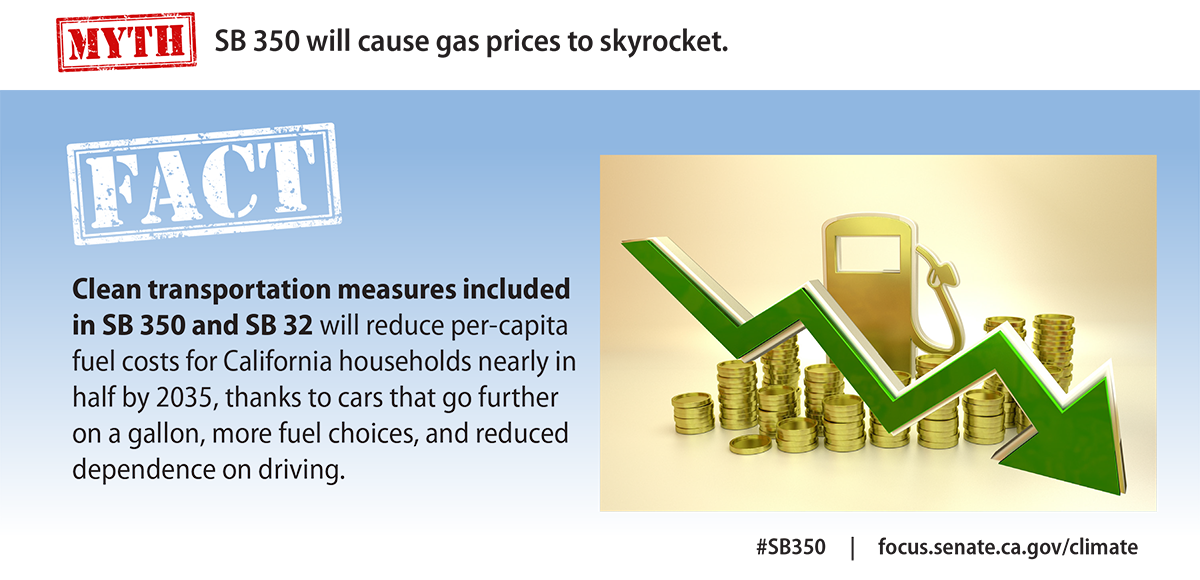
The best way to shield consumers from volatile gas prices is to reduce our dependence on gasoline. SB 350 will save Californians money at the pump by lowering demand for petroleum and growing the supply of clean, affordable alternatives.

SB 32 clean transportation measures will reduce per-capita fuel costs for California households nearly in half by 2035, thanks to cars that go further on a gallon, more fuel choices, and reduced dependence on driving
SB 350 and fuel
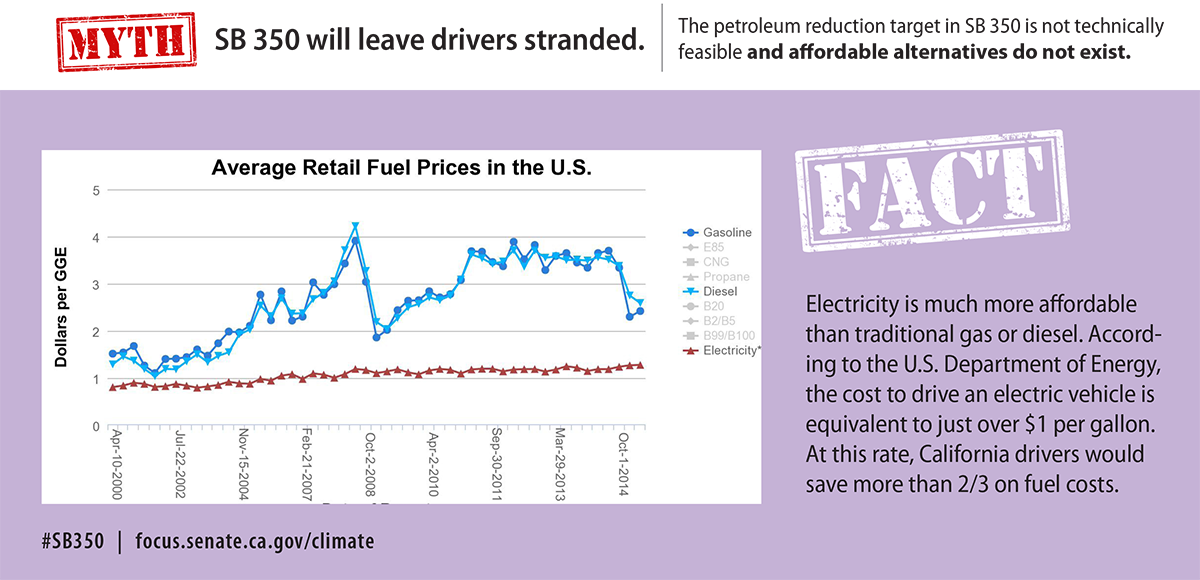
These claims are based on multiple misleading assumptions. WSPA claims SB 350 petroleum goal will leave drivers stranded because it will require us to stop using gasoline, and viable alternatives don’t exist (they cite cost and range limitations of EVs).

SB 350 supports consumer choice by increasing diversity in our vehicle, fuel, and transportation options. The bill does not require us to abandon gasoline altogether, it requires the state overall to achieve up to a 50% reduction in petroleum use, which can be met through a combination of cleaner fuels, increased fuel efficiency and other strategies.

California has more than 150,000 electric vehicles on the road, more than any other state. In 2008, automakers offered only 12 car models that could achieve 30 miles per gallon or more; in 2013 more than 70 such models were available for sale.

California gasoline use has fallen by 10.5 percent since 2006, compared with a decline of only 6 percent nationally durip that time, and Californians in 2012 used the same amount of gasoline they used in 2000 despite economic growth and a 12 percent increase in population.

Electric vehicles have more than enough range to meet the transportation needs of the average California driver. According to the Legislative Analyst’s Office, the average California driver in 2013 drove less than 40 miles per day. (Cal Facts 2014). Pure battery electric vehicles can generally go 60 – 120 miles on a full charge. If additional range is needed, plug-in hybrids can go 10-40 miles on pure electricity, and then have range of up to 400 miles as a hybrid gas-electric vehicle.

Electricity is much more affordable than traditional gas or diesel. According to the U.S. Department of Energy, the cost to drive an electric vehicle is equivalent to just over $1 per gallon. At this rate, California drivers would save more than 2/3 on fuel costs.

NASCAR uses 15% ethanol blend in its cars – nearly three times the concentration of the average gallon of gasoline currently sold in California (5.7%).

Cars today are 90% more fuel efficient and cleaner than they were just 20 years ago, thanks to strong state and federal standards.
SB 350 and Energy Costs

Wind and solar are now cheaper per kilowatt hour than fossil fuels like natural gas and coal in many energy markets.
- According to a 2014 report by the California Energy Commission, when assessed over the lifetime of the facility generating it, electricity from most renewable sources is now cheaper than natural gas and is expected to become even more price-competitive over the next 10 years.
- Solar photovoltaic (PV) contract costs for California’s largest utilities declined by 62 percent on average since 2007. By 2016, they are predicted to match the cost of electricity purchased from the grid.

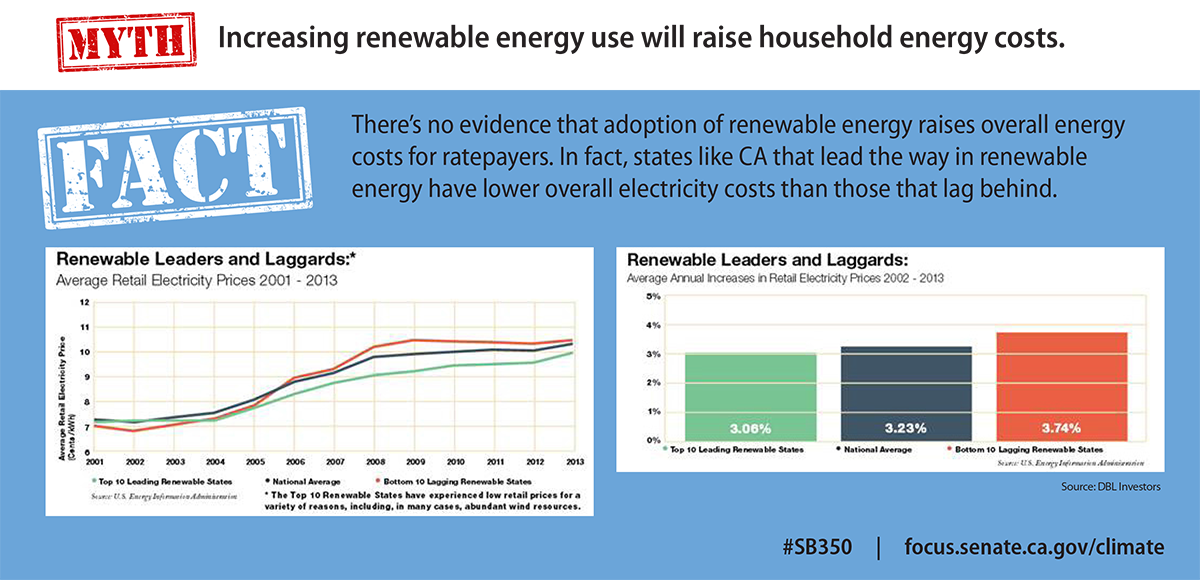
There’s no evidence that adoption of renewable energy raises energy costs for ratepayers. In fact, according to the venture capital firm DBL Investors, states like CA that lead the way in adoption of renewable energy technologies have lower overall electricity costs than those that lag behind.

California’s overall household electricity costs are low. According to the Energy Information Administration, California’s residential energy bills are actually among the lowest in the nation — CA ranks 49th in energy use and 46th in per-person spending on electricity.

Renewable energy has “level” costs over the life of a power plant. Once you build it, the “fuels” (sun, wind, steam from the ground) are free. That’s not true with fossil fuels whose prices fluctuate widely based on factors California can’t control.
SB 350 and renewable targets

Between 2007 and 2015, California’s total renewable energy generation more than doubled from 12% to nearly 25% of the state’s retail sales.

California’s investor-owned utilities are already on pace to surpass the 2020 target of 33%.

Utility-scale solar generation in California has increased nearly six-fold since 2012. (CA Independent Systems Operator data).

A National Renewable Energy Laboratory study found that reaching (and surpassing) 50% renewables by 2030 is not only achievable, it will create “minimal rate impacts, uncompromised reliability, and wide-spread economic development.”

A 2015 survey shows that an overwhelming 83 percent of Californians support the state generating 50 percent of its electricity from renewable resources, with strong majorities in every region and across party lines.
SB 350 and the Air Resources Board
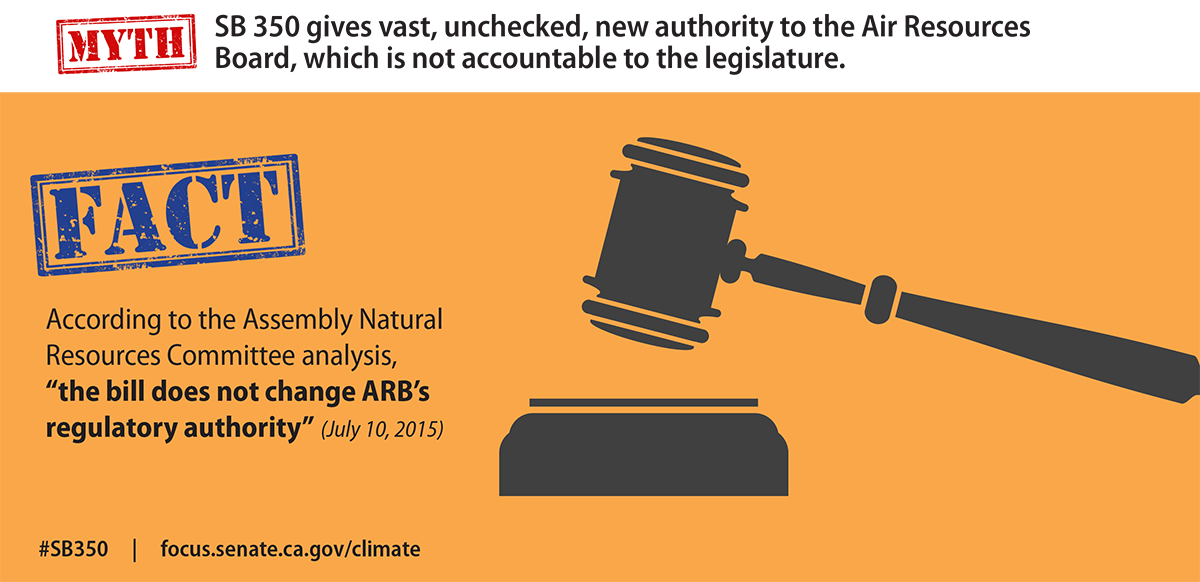

The 50% petroleum reduction requirement appears on page 4 line 20 of the bill. The requirement is followed by 2 single spaced pages and over a hundred lines of detailed legislative direction.
- It requires the petroleum reduction to be cost effective and technologically feasible (page 4, line 19)
- It requires any actions to be based on validated scientific and engineering data (page 5, line 12)
- It explicitly requires an economic analysis that takes into account impacts on fuel manufacturers, consumer acceptance, the state’s competitive position with other neighboring states, and the costs to consumers (page 5, lines 30-34)
